Making Glyph 20× Faster
How I took Glyph's render loop from 50ms/frame down to 2.4ms — persistent Yoga nodes, dirty subtree tracking, clip culling, text caching, and a lot of profiling.
I wrote about how Glyph works a couple days ago. That post describes the architecture — reconciler, Yoga layout, framebuffer, diff. Clean, elegant pipeline.
What it doesn’t mention is that it was slow as hell.
The result
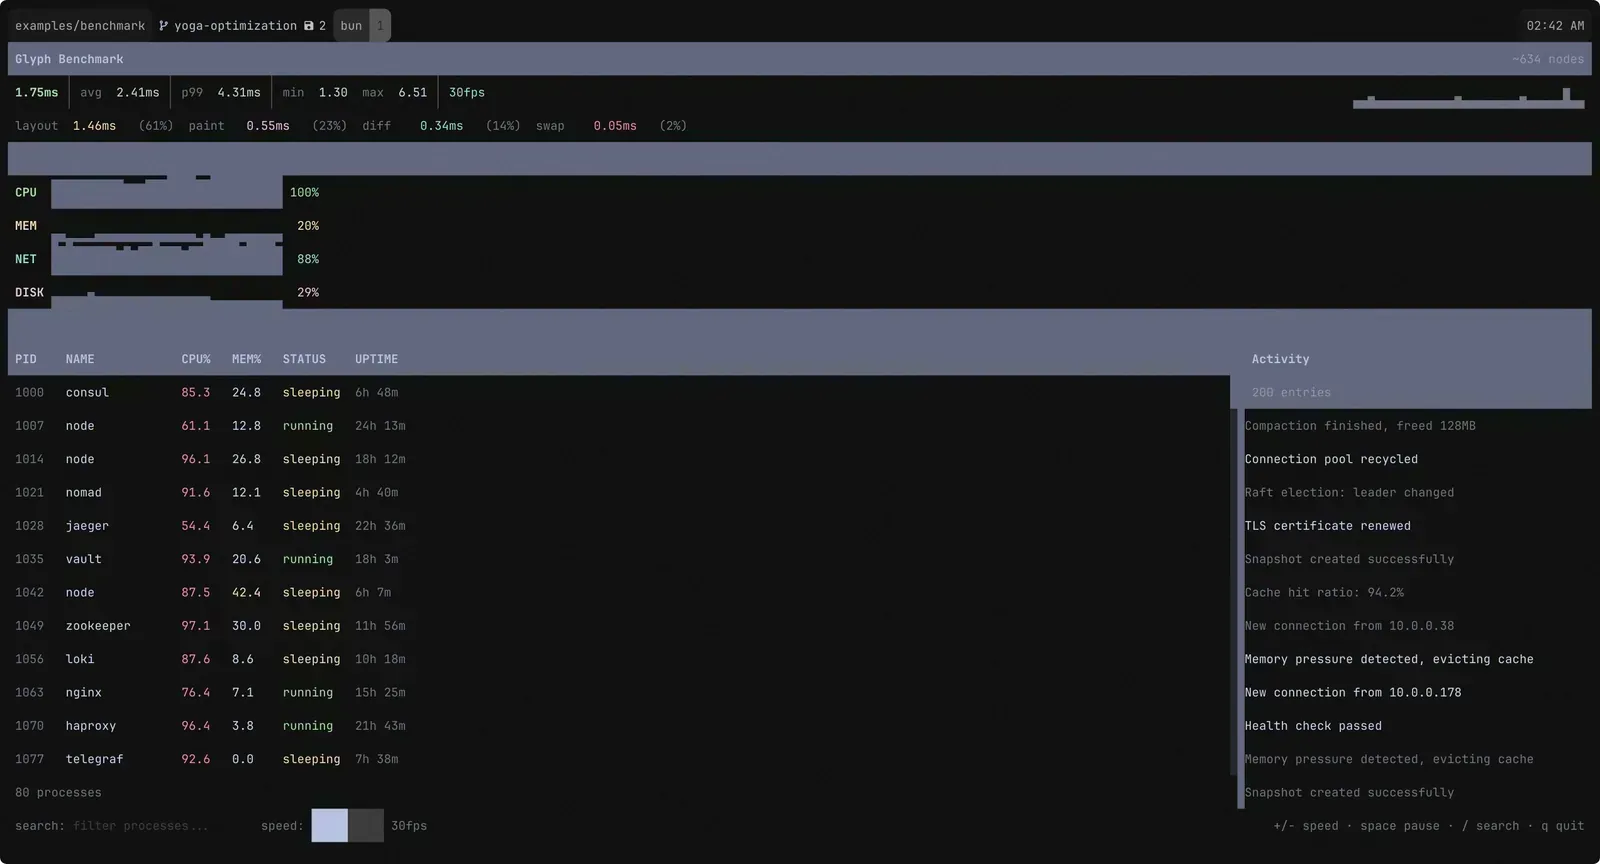
For the impatient ones, this is what it looks like after all the improvements. See the numbers? That’s it, sub-3ms render time per frame. Pretty neat, huh?
The Problem
I’d been building Aion and Epist on top of Glyph and they felt fine. Responsive, snappy. But I had a nagging feeling I was getting lucky — those apps update on user input, not continuously. What happens when the renderer is under real pressure?
So I built a benchmark. A simulated system dashboard: 80 processes in a scrollable table with live CPU/memory stats, 4 sparkline metrics, a 200-entry scrollable activity log that adds and removes entries every tick, and a search bar for filtering. About 215 GlyphNodes in the tree. Structural changes every single frame. 30fps state updates.
I fired it up and immediately felt sick. 50ms per frame. Fifty. You could see the lag. The sparklines stuttered. Text felt like it was being painted through molasses.
For a framework that’s supposed to make terminal UIs feel native, this was unacceptable.
Before Touching Anything: Profile
My first instinct was “the diff is slow.” Character-by-character comparison across 4,800 cells — that’s gotta be it, right?
Wrong. I added performance.now() instrumentation around every phase of the render pipeline and wrote the results to a CSV. The first thing I saw:
Yoga layout was eating most of the frame time.
Not the diff. Not painting. Not text processing. The flexbox engine. Specifically, I was creating the entire Yoga tree from scratch every frame — Yoga.Node.create() for every node, apply all styles, attach all children, calculate, extract positions, then freeRecursive(). Every frame. For 215 nodes.
In the “how it works” post, I even bragged about this approach. “Yoga is absurdly fast — a full layout for a complex app takes under a millisecond.” That was true for simple apps. For 215 nodes at 30fps, the WASM allocation/deallocation churn was brutal.
So the diff was fine. The framebuffer was fine. My layout strategy was the problem. Good thing I profiled instead of guessing.
The Easy Wins
Before tackling the Yoga problem, I knocked out a few quick things that showed up in the profile.
resolveNodeStyles was re-resolving every node’s responsive breakpoint values every frame, even though terminal dimensions almost never change mid-session. Added a per-node cache keyed on the style reference and terminal column count — if neither changed, skip.
diffFramebuffers was building its ANSI output via string concatenation — each += allocates a new string. Replaced it with a pre-allocated Buffer that grows geometrically and persists across frames. After a few frames it never reallocates again. One buf.toString('utf8', 0, off) at the end.
The framebuffer itself was allocating new cell objects in clear() and copyFrom(). Restructured to pre-allocate all cells once in the constructor and mutate in place. Zero allocations per frame. The GC barely notices we exist.
These were small wins individually. Maybe 5-6ms combined. But they’re the kind of thing you do first because they’re easy, they’re correct, and they clear the noise from the profile so you can see what actually matters.
Rearchitecting Yoga (The Hard Part)
OK. The real problem. Most of the frame time was rebuilding the Yoga tree.
The solution was obvious in retrospect: don’t rebuild it. Create each Yoga node once when the GlyphNode is created, keep it alive for the node’s entire lifetime, and only free it when React permanently detaches the node.
export function createGlyphNode(type, props): GlyphNode { return { type, props, yogaNode: Yoga.Node.create(), // Born once, lives until detach // ... };}Simple concept. Awful execution. This was the hardest change in the entire optimization because it touched everything.
The original code had a clean flow: build Yoga tree → calculate → extract → free. Now I needed the Yoga tree to persist and stay synchronized with the React tree across arbitrary mutations. Every appendChild, removeChild, and insertBefore in the reconciler needed a corresponding Yoga operation.
I got it working in about a day. Then I spent another two days debugging layouts that were almost right but subtly wrong. The culprit? Yoga’s WASM API silently accepts undefined values. It doesn’t throw. It doesn’t warn. It just produces NaN layout values that propagate through the tree and corrupt everything downstream.
// This looks fine. It is not fine.yogaNode.setPadding(Edge.All, style.padding);// If style.padding is undefined, Yoga accepts it and your layout becomes NaN soupEvery single property setter needed an explicit !== undefined guard. I went through them one by one, muttering obscenities. Yoga’s WASM bindings are great until they aren’t.
But once that was sorted out — damn. Layout time dropped from ~35ms to ~3ms. The Yoga calculateLayout call itself takes under 1ms. All that overhead was allocation and tree construction.
Everything Flickered
Frame time was way down. Great progress! Except the screen flickered like a broken fluorescent light.
Here’s what was happening: I had a fullRedraw flag that cleared the terminal screen (\x1b[2J). It was supposed to fire only on resize and init. But structural changes — which happened every frame because the activity log was adding and removing entries — were also triggering it. 30 full screen clears per second. Of course it flickered.
The fix was separating two concepts I’d accidentally conflated:
fullRedraw: clear the terminal screen. Resize and init only.fullRepaint: clear the framebuffer and repaint all nodes. Structural changes and resize.
Screen clears stopped. Flicker gone. The diff engine handles incremental updates — that’s literally its job. I just had to stop sabotaging it.
The Dirty Flag Revolution
With the flicker fixed, I looked at the profile again. The paint phase was next. Every structural change triggered a full repaint of all 215 nodes — because a single global _structuralChange flag was the only tracking mechanism. One log entry added? Repaint every process row, every metric, every border.
I replaced it with per-node _paintDirty flags. When a child is appended or removed, only the parent gets marked dirty. When layout values change, only that node gets marked. The paint loop checks each node’s flag and propagates an ancestorDirty flag downward — so if a parent is dirty, its children repaint too. But siblings? Untouched.
This was the moment it clicked for me that almost every optimization in this project would be about skipping work, not making work faster. The paint code didn’t get more efficient. It just ran on fewer nodes.
Caching Text
paintText was another offender. Every frame, every text node: collect styled segments, parse ANSI codes, word-wrap to the available width, merge inherited styles, compute auto-contrast colors. All of this for text that hadn’t changed.
I added a _textCache on each node — pre-computed styled character arrays keyed on text content, inner width, resolved style reference, and inherited style values. On cache hit, skip all processing and replay the cached characters straight to the framebuffer.
Text cache hit rate went from ~2% (basically useless) to 85%+. Turns out most text in a UI doesn’t change most of the time. Who knew.
Skip Layout Entirely
Here’s a fun one. If nothing that affects layout has changed — no style updates, no text length changes, no structural mutations — why run layout at all?
if (!force && !isLayoutDirty()) { return false;}markLayoutDirty() is called from commitUpdate (when styles change), commitTextUpdate (when text length changes), and the tree mutation hooks. If none of those fired, layout is guaranteed unchanged. Skip resolveNodeStyles, syncYogaStyles, calculateLayout, and extractLayout entirely.
On frames where only non-layout state changes — cursor blink, selection highlights, that kind of thing — layout cost drops to zero. Zero.
The ScrollView Problem
I noticed something weird in the profile. The activity log — 200 entries, but only ~15 visible in the ScrollView viewport — was still dominating paint time. All 200 entries were in the paint list. Each one was getting processed, styled, and written to the framebuffer. The clip rect correctly prevented visible output, but the work was still happening.
Added clip rect culling in collectPaintEntries. Before adding a node to the paint list, check if it’s entirely outside its parent’s visible area. If it is, skip it and all its descendants:
const { x, y, width, height } = node.layout;if ( x >= parentClip.x + parentClip.width || x + width <= parentClip.x || y >= parentClip.y + parentClip.height || y + height <= parentClip.y) { return; // Off-screen — skip entire subtree}Paint entries dropped from ~600 to ~45. For any app with scroll views — which is basically any real app — this is a massive win.
I added the same idea to extractLayout. Even with Yoga’s hasNewLayout() flag telling me which nodes were recalculated, all 600 nodes under the activity log had new layout every frame (structural changes from log add/remove). But only ~45 were visible. Added clip rect propagation through extractLayout — off-screen nodes get one cheap position check, then their entire subtree is skipped. ~3,700 WASM calls avoided per frame.
The Reference Identity Cascade
The next batch of optimizations was the most satisfying because they were all connected.
React re-renders create new style objects even when values are identical. <Box style={{ bg: "red" }}> — every render, new object. My resolveNodeStyles saw a new reference, resolved a new style, produced a new resolvedStyle — which cascaded through everything. syncYogaStyles applied WASM calls (different style reference), text cache invalidated (different style reference), nodes marked dirty (different style reference).
One three-line fix: shallow-compare the resolved style values before replacing the reference. Same values? Keep the old object. This single change cascaded upward through every caching layer.
But that wasn’t enough. React’s reconciler calls commitUpdate on every node it touches during a render — and the original implementation unconditionally set _paintDirty = true. React re-renders the whole tree on state changes, so all 215 nodes were dirty every frame. All the incremental paint work from the dirty flag system? Completely nullified.
Added shallowStyleEqual in commitUpdate. Only mark _paintDirty when style values actually differ. Dirty entries dropped from 215/215 → ~70/215. All the infrastructure I’d built for dirty tracking finally got to do its job.
The last piece: Yoga’s hasNewLayout() API. Instead of calling getComputedLayout() + getComputedPadding() × 4 on every node (5 WASM calls each), check hasNewLayout() first. If Yoga didn’t recalculate the node and its parent didn’t move, skip the entire subtree — zero work. If the parent moved but the node’s relative position is unchanged, just apply an arithmetic delta — zero WASM calls.
These three changes — stable style references, smart commitUpdate, and hasNewLayout() — were individually small. Together they reduced WASM calls from ~4,200 to ~500 per frame.
Atomic Renders (DEC 2026)
At this point I was sitting at about 12ms per frame. Way better than 50ms, but still not where I wanted to be. The profiler was pointing at something I hadn’t considered: the diff phase was fast, but the terminal write was slow. Not the write() syscall itself — the terminal processing the output on the other end.
Here’s the problem. When you push a frame’s worth of escape sequences to stdout, the terminal processes them incrementally. Move cursor, set color, write cell, move cursor, set color, write cell — thousands of operations, and the terminal is rendering intermediate states the entire time. Each intermediate render creates backpressure on stdout. The process writing bytes has to wait for the terminal to consume them, and the terminal is busy painting half-finished frames it’s going to immediately overwrite.
The cursor made it especially visible. In Ghostty, which has a smooth cursor shader, you could see it dancing between positions mid-frame. Tearing across the whole screen. I tried hiding/showing the cursor around each frame. Tried batching everything into a single write(). Still slow, still tearing — one write() doesn’t mean one paint.
The fix was DEC mode 2026 — synchronized output. Send \x1b[?2026h to begin a sync block, write all your frame data, then \x1b[?2026l to end it. The terminal buffers everything between those markers and paints it as a single atomic operation.
// Begin synchronized update — terminal buffers everythingwriteAscii(`${CSI}?2026h`);
// Hide cursor so it's not visible at intermediate positionswriteAscii(`${CSI}?25l`);
// ... write all cell changes, SGR sequences, cursor moves ...
// Position cursor at its final location, show itwriteAscii(`${CSI}${cursorY + 1};${cursorX + 1}H`);writeAscii(`${CSI}?25h`);
// End synchronized update — terminal paints everything at oncewriteAscii(`${CSI}?2026l`);
The impact was way bigger than I expected. Frame time dropped from ~12ms to ~2.4ms. Not a typo — 5× faster from a single protocol change. The terminal was no longer doing intermediate rendering work during the write. No backpressure. No wasted paints. Just buffer, buffer, buffer, then one atomic flush. The tearing and cursor flicker disappeared as a bonus.
Ghostty, Kitty, WezTerm, iTerm2, foot, and Contour all support it. Terminals that don’t simply ignore the sequences — zero compatibility cost. I also had to disable auto-wrap (\x1b[?7l) inside the sync block because some terminals (Kitty, Ghostty) have edge cases where the pending-wrap state from writing the last column corrupts cursor positioning when combined with DEC 2026. Subtle bug, took a while to track down.
This was the single biggest performance win in the entire optimization. All the other changes were about reducing the renderer’s work. This one was about not fighting the terminal.
The Numbers
| Metric | Before | After |
|---|---|---|
| Frame time | ~50ms | ~2.4ms |
| Dirty entries/frame | 215/215 | ~70/215 |
| Pre-clear cells | 25,000 | 1,700 |
| Text cache hit rate | 2% | 85%+ |
| WASM calls (layout) | ~4,200 | ~500 |
20× faster. The benchmark runs at 30fps with ~2.4ms frame time and ~30ms of headroom per frame.
What’s Left
yogaCalculate still takes ~0.86ms — that’s Yoga’s internal WASM cost for 600 nodes. The benchmark forces structural changes every tick, so Yoga must recalculate. The renderer itself — everything minus Yoga — runs under 2ms.
The only way past this ceiling is reducing the Yoga node count (virtual scrolling) or using a lighter layout engine. For now, ~2.4ms is plenty.
The Real Lesson
Almost every optimization here was about not doing something. Not resolving unchanged styles. Not rebuilding the Yoga tree. Not painting off-screen nodes. Not processing unchanged text. Not calling WASM for nodes that didn’t move.
The actual algorithms — the diff, the paint, the layout extraction — barely changed. They’re not faster. They just run on fewer things. And that’s the trick, isn’t it? The fastest code is the code that doesn’t run.
Also: profile first. My gut said “the diff is slow.” My gut was completely wrong. If I’d optimized the diff I would’ve shaved maybe 0.3ms off a 50ms frame. Instead I found the actual bottleneck and got a 20× speedup. Profilers don’t lie. Intuition does.
The full code is at github.com/semos-labs/glyph. The benchmark is in examples/benchmark if you want to run it yourself.